|
|
| |
|
|
| |
|
|
| |
| 17-12-2013 |
|
| 29 years PT Pipa Mas Putih |
 |
PT PIPA MAS PUTIH began production of industrial quality screens for the oil, gas, water, mining and food industries in 1985. This has been a period of challenge for all PIPAMAS staff as our company rapidly expanded to meet the market demand for our produ
 |
|
|
|
|
|
|
|
| |
| |
Sand control is the technology and practice of preventing sand flow from unconsolidated sandstone formations.
Two objectives are aimed by implementing sand control technique,
- to control sand flow from an unconsolidated sandstone reservoir into the well bore
- to obtain reservoir fluid flow as close as possible to reservoir fluid flow at open hole condition
Movement of naturally occurring sand particles originated from unconsolidated hydrocarbon sandstone reservoir into the well bore has become a major production problem faced in producing oil and / or gas. This sand problem commonly occurs in younger Tertiary sediments, particularly of Miocene epoch. It can also occur in older Tertiary formation when local rock stress and rock strength are affected by certain well completion practices and well production operations causing an unstable subsurface condition. It should also be apparent that sand production is often a production rate sensitive as the production rate determines the pressure drawdown (or grain stress contact), drag forces working on the sand grain, and in some cases, the water saturation magnitude in the well bore vicinity (due to water coning effect) inside the well bore across the productive interval.
Formation sand production can leads to any or all of the following problems:
- casing collapse
- abrasion of surface and subsurface equipment;
- well’s productivity reduction
- "sanded-up" well bore
Field experience indicates that sand control should be installed before the formation reservoir rock is disturbed by sand flow. It becomes more difficult to control sand flow as the volume of sand production increases. Thus, it is obvious that initial sand control installation have proved to be much more successful than remedial actions.
Methods for controlling sand production have been generally involved one of the five following approaches:
- restricted production rate
- mechanical sand control / gravel packing using a metal screen and gravel grain barrier that screens out the formation sand but does not inhibit fluid flow from the formation into the wellbore
- sand consolidation by injecting an epoxy resin into the formation near the wellbore, allowed it to harden, and will cement the sand grains together which will prevent them from their movement
- “FracPacking”, a combined treatment involving fracture stimulation and sand control
- oriented and/or selective perforation
PT Pipa Mas Putih has been contributed to the sand exclusion activities by producing metal wire-wrapped screens which is one of the essential equipment used in mechanical sand control type / gravel packing.
This type of sand control requires,
- proper metal wire wrapped screen slot width opening size and,
- proper gravel grain barrier size determinations
to achieve a bridging or absolute stopping of sand formation flow without significantly inhibit reservoir fluid flow capacity.
The basis for those essential size determinations is formation grain size distribution which is generated from formation sample collections.
Sources for formation samples are,
- Bottom hole full length and full diameter cores taken while conducting drilling operation.
This the best source for generating formation grain size distribution as formation grain size can greatly vary through out the formation.
- Sidewall cores taken while conducting along with open hole logging operation.
This type of formation sample source is used if the bottom hole cores are not available. The formation samples originated from the side wall cores may not as good as from the bottom hole cores as they may contain some drilling solids and fines resulting from shallow drilling mud invasion occurred during drilling operation.
- Produced flowing formation samples obtained from back surging.
Although not a good source for formation samples, in the absence of bottom hole full length and sidewall cores, the samples can be valuable. either produced flowing. The produced flowing formation samples will have a tendency to be skewed to a small grain size distribution as a result of gravity segregation when flowing up the wellbore.
- Bailed formation samples.
With similar quality as produced flowing formation samples, the bailed formation samples will tend to be skewed to a larger grain size distribution as larger and heavier formation samples which are not produced up the well bore, will tend to be dropped to the bottom of the hole, filling up the “rat hole”.
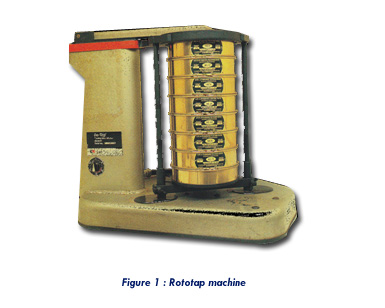
In order to generate a formation grain size distribution, an analytical technique called “Sieve Analysis Test” is employed involving sieving a disaggregated core sample through a series of screens with increasingly finer mesh.
Figure-1 is a picture of a Rototap machine loaded with number of Tyler sieves utilized by PT Pipa Mas to perform a “Sieve Analysis Test” for its customer.
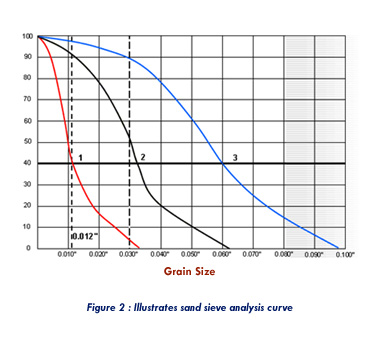
Formation sample retained on each screen is weighed and the results are plotted on a graph paper. It is common to present the grain size distribution plot, expressed in either “inches” unit or “millimeters” unit, as a function of cumulative weight percent of the total sample as depicted on Figure-2.
Detailed procedure for conducting this test analysis can be obtained from “US Standard Sieve Series – ASTM Spec. E1170.
Tabel-1 and Table-2 have been taken from World Oil’s “Sand Control Handbook” by George O. Suman, Jr, presents the relationship of US Standard mesh, Tyler mesh, inches, and mm/micron and available gravel grain sizes available in the market respectively.
 |
 |
|
| 2,5 |
|
0,315 |
|
8,0 mm |
|
 |
| |
2,5 |
0,312 |
|
7,925 mm |
|
|
| 3 |
|
0,265 |
|
6,73 mm |
|
|
| |
3 |
0,263 |
|
6,68 mm |
|
|
| 3,5 |
|
0,223 |
|
5,66 mm |
|
|
| |
3,5 |
0,221 |
|
5,613 mm |
|
|
| 4 |
|
0,187 |
|
4,76 mm |
|
|
| |
4 |
0,185 |
|
4,699 mm |
|
|
| 5 |
|
0,157 |
|
4,00 mm |
|
|
| |
5 |
0,156 |
|
3,962 mm |
|
|
| 6 |
|
0,132 |
|
83,36 mm |
|
|
| |
6 |
0,131 |
|
3,327 mm |
|
|
| 7 |
|
0,111 |
|
2,83 mm |
|
|
| |
7 |
0,110 |
|
2,794 mm |
|
|
| 8 |
|
0,0937 |
|
2,38 mm |
|
|
| |
8 |
0,093 |
|
2,362 mm |
|
|
| 10 |
|
0,0787 |
|
2 mm |
|
|
| |
9 |
0,078 |
|
1,981 mm |
|
|
| 12 |
|
0,0661 |
|
1,68 mm |
|
|
| |
10 |
0,065 |
|
1,651 mm |
|
|
| 14 |
|
0,0555 |
|
1,41 mm |
|
|
| |
12 |
0,055 |
|
1,397 mm |
|
|
| 16 |
|
0,0469 |
|
1,19 mm |
|
|
| |
14 |
0,046 |
|
1,168 mm |
|
|
| 18 |
|
0,0394 |
|
1 mm |
|
|
| |
16 |
0,039 |
|
991 mm |
|
|
| 20 |
|
0,0331 |
|
840 mm |
|
|
| |
20 |
0,0328 |
|
833 mm |
|
|
|
 |
|
|
|
|
|
| 25 |
|
0,028 |
|
710 microns |
|
|
| |
24 |
0,0276 |
|
700 microns |
|
|
| 30 |
28 |
0,0232 |
|
589 microns |
|
|
| 35 |
|
0,0197 |
|
500 microns |
|
|
| |
32 |
0,0195 |
|
495 microns |
|
|
| 40 |
|
0,0165 |
|
420 microns |
|
|
| |
35 |
0,0164 |
|
417 microns |
|
|
| 45 |
42 |
0,0138 |
|
351 microns |
|
|
| 50 |
|
0,0117 |
|
297 microns |
|
|
| |
48 |
0,0116 |
|
295 microns |
|
|
| 60 |
|
0,0098 |
|
250 microns |
|
|
| |
60 |
0,0097 |
|
246 microns |
|
|
| 70 |
|
0,0083 |
|
210 microns |
|
|
| |
65 |
0,0082 |
|
208 microns |
|
|
| 80 |
|
0,007 |
|
177 microns |
|
|
| |
80 |
0,0069 |
|
175 microns |
|
|
| 100 |
|
0,0059 |
|
149 microns |
|
|
| |
100 |
0,0058 |
|
147 microns |
|
|
| 120 |
115 |
0,0049 |
|
124 microns |
|
|
| 140 |
150 |
0,0041 |
|
104 microns |
|
|
| 170 |
170 |
0,0035 |
|
88 microns |
|
|
| 200 |
200 |
0,0029 |
|
74 microns |
|
|
| 230 |
250 |
0,0024 |
|
62 microns |
|
|
| 270 |
270 |
0,0021 |
|
53 microns |
|
|
| 325 |
325 |
0,0017 |
|
44 microns |
|
|
| 400 |
400 |
0,0015 |
|
37 microns |
|
|
| |
|
|
|
|
|
|
| |
|
|
|
|
|
|
|
|
|
 |
 |
|
| 0,006 x 0,017 |
40/100 |
0,012 |
 |
| 0,008 x 0,017 |
40/70 |
0,013 |
|
| 0,010 x 0,017 |
40/60 |
0,014 |
|
| 0,017 x 0,033 |
20/40 |
0,025 |
|
| 0,023 x 0,047 |
16/30 |
0,035 |
|
| 0,033 x 0,066 |
12/20 |
0,050 |
|
| 0,039 x 0,066 |
12/18 |
0,053 |
|
| 0,033 x 0,079 |
10/20 |
0,056 |
|
| 0,047 x 0,079 |
10/16 |
0,063 |
|
| 0,066 x 0,094 |
8/12 |
0,080 |
|
| 0,079 x 0,132 |
6/10 |
0,106 |
|
|
 |
A plotted of formation grain size distribution illustrated in Figure-2 will normally encounter an “S-shaped” distribution curve. This “S-shaped” distribution curve can be used as a qualitative magnitude on “Sand’s uniformity”. If the “S-shaped” curve is further to the left on the horizontal axis that the distribution curve falls, the coarser the material. The more uniform the sample, the more vertical the “S-shaped” curve distribution is going to be, and a completely uniform sample would result in a vertical line of “S-shaped” curve distribution.
Proper terminology should be used in specifying wire wrapped screen slot width opening size when making an order. The expression “gauge” which is a screen slot width opening size in thousandths of an inch, is frequently used, i.e., 12 gauge slot width = 0,012 inch slot width.
Some technical guidelines have been developed to select proper wire wrapped screen slot width opening size and gravel grain barrier size that will prevent formation sand movement based on formation grain size distribution determined from sieve analysis test along with the qualitative magnitude on sand formation uniformity. |
|
|
| |
|
|
 |